A great project plan is only useful if you can share it. LoopGantt exports a project in seven formats, from a report for stakeholders to a data file for another tool, and you can export from any view of the project.
How to export
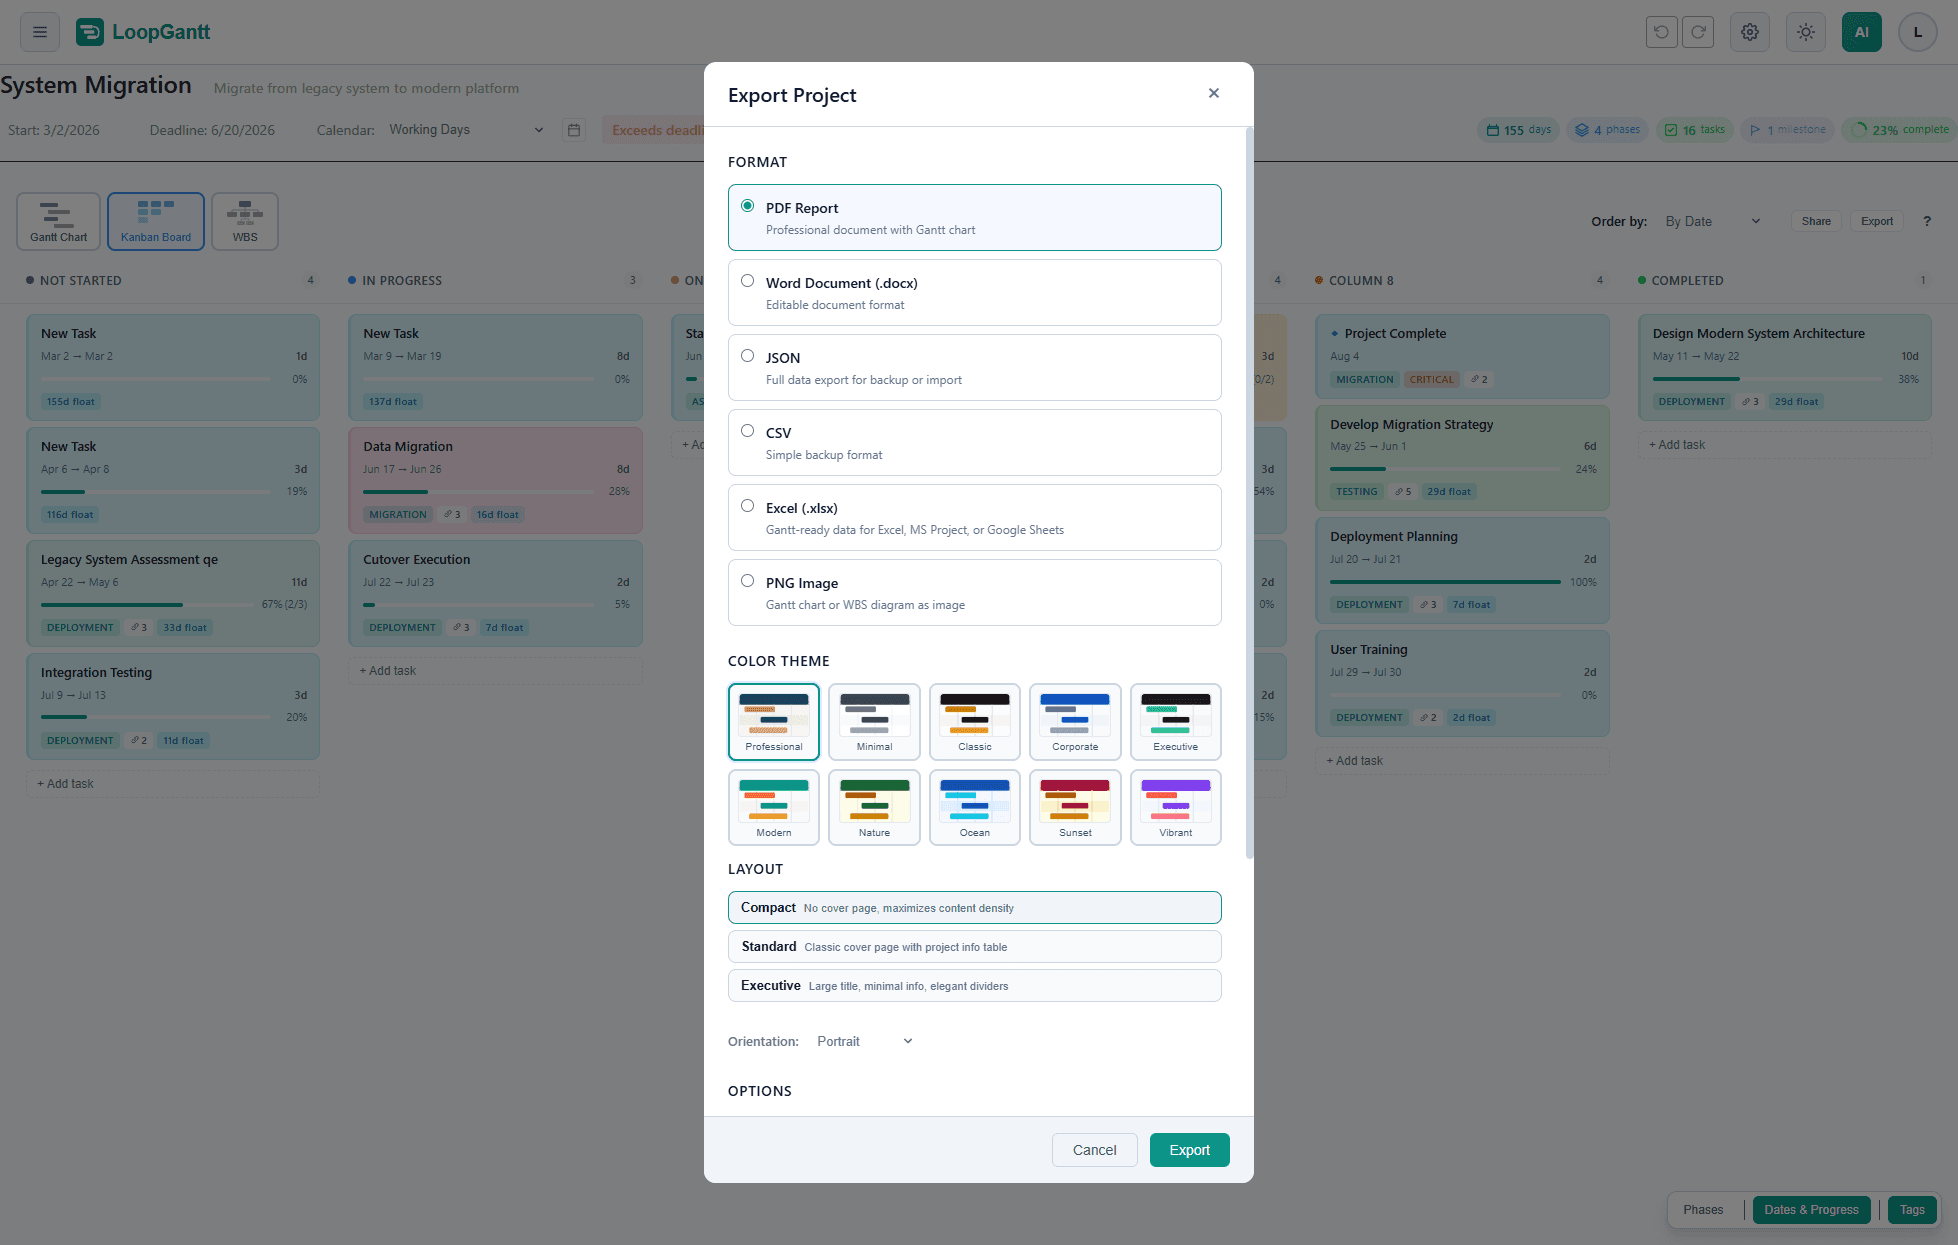
- Open your project.
- Click Export in the project toolbar. On a phone, tap the export icon at the top of the screen.
- Choose a format and adjust its options.
- Click Export. The file downloads when it's ready.
Formats and plans
| Format | What you get | Plan |
|---|---|---|
| PDF Report | A report with your Gantt chart and the sections you choose | Free; some layouts, themes and the Vector renderer are Pro |
| Word Document (.docx) | The same report as an editable Word file | Pro |
| PNG Image | The Gantt chart or the WBS diagram as an image, or as an SVG file | Free; 4K/5K images and SVG are Pro |
| Excel (.xlsx) | Gantt-ready data for Excel, MS Project, or Google Sheets | Pro |
| MS Project XML (.xml) | A file that opens in Microsoft Project 2016 or later, with the schedule, links and calendar | Pro |
| CSV | One row per task, for spreadsheets and other tools | Free |
| JSON | The full project data, for backup or to import again | Free |
Everything marked Pro is also included in the Teams plan. If you're on the Free plan, choosing a Pro option opens the upgrade dialog.
PDF and Word
PDF and Word share the same options:
- Layout: Compact (no cover page, the most content per page; free and the default), Standard (classic cover page with a project info table) or Executive (large title and elegant dividers). Standard and Executive are Pro; you can open a preview with sample data before upgrading.
- Renderer: Standard captures the Gantt chart as an image, which is fine for most views (free and the default). Vector — Premium renders a sharper, higher-resolution chart (Pro).
- Color Theme: ten themes. Professional (the default) and Minimal are free; Classic, Corporate, Executive, Modern, Nature, Ocean, Sunset and Vibrant are Pro.
- Options: choose which sections to include: the Gantt chart (with or without its task list), the task table, custom fields, milestones, the summary, the critical path summary, the WBS diagram, PMP metrics (SPI, float, forecast) and the health dashboard (status, pace, baseline). You can also add the generation time to the page footer.
- Project Settings: a logo, owner name and title, and company for this project's reports.
When the project uses Advanced PM resources, costs or tracking, an appendix with those tables is added after the Gantt chart automatically.
PDFs from the Free plan carry one small "Generated in LoopGantt.com" line at the bottom of each page; there is no watermark. Pro PDFs and Word documents carry no LoopGantt credit.
PNG — Image of the chart
Choose the Chart Type: the Gantt chart or the WBS diagram. For the Gantt chart you can also set:
- Include Task List: shows the task names beside the bars.
- Time scale: Auto-fit (recommended), Half-day, Day, Week, Month or Quarter.
- PNG Standard, PNG Premium or SVG: PNG Standard is FHD or QHD (free); PNG Premium is 4K or 5K, for print and large displays (Pro); SVG is a vector file you can zoom without limit (Pro).
- Single image: one big image instead of pages, for long projects.
- Custom date range: export only part of the timeline.
The Color Theme picker adds Light and Dark, which keep your own task colors, to the ten themes above. Images from the Free plan carry a small "Generated in LoopGantt.com" line under the chart.
Data formats
- Excel (.xlsx): one row per task with the ID, WBS, outline level, type, duration, dates, deadline, predecessors, % complete, status, priority, critical flag, total float, resource names, notes and custom fields.
- MS Project XML (.xml): the schedule, dependencies and calendar, plus resources and assignments when Advanced PM is on.
- CSV: the columns are WBS, Name, Description, Duration (Days), Start Date, End Date, Deadline, Status, Progress (%), Dependencies, Total Float, Free Float, Critical, Milestone, Phase and Priority, plus your custom fields. Column headers are always in English, so other tools can read them.
- JSON: everything needed to rebuild the project: task fields including colors and checklists, dependency types (FS/SS/FF/SF) and lag days, custom fields and project metadata. Use it to back up your project, to import it again, or to generate a new project with an AI assistant (see Use Your Own AI to Generate a Project).